Bestiapop - A python package for climate data extraction, processing and visualisation in crop models


Climate data is an essential input for crop models to predict crop growth and development using site-specific (point) or gridded climate data. While point data is currently available in MET format, gridded data is provided in NetCDF file format which is difficult to store and convert to an input file readable by APSIM or other crop models. We developed bestiapop (a spanish word that translates to pop beast), a Python package which allows model users to automatically download thousand files of gridded climate data from two data sources SILO and NASAPOWER in a crop model format such as MET format in APSIM or WHT format in DSSAT that can then be inputted for crop modelling predictions. The package offers the possibility to select a range of grids (5 km × 5 km resolution) and years producing various types of output files: MET, WHT and CSV and soon SQLite and Jason. Users can also visualise data statistics (mean, standard deviation, CV, etc) spatially for any selected region in the world.
Authors
Data Analytics Specialist & Code Developer: Diego Perez @darkquassar
Data Scientist, Crop Physiologist & Crop Modeller: Jonathan Ojeda @JJguri
Use it in Jupyter Notebook
If you would like to use BESTIAPOP in you Jupyter Notebook, you can! Please see the example notebook. You can also try it live in Binder Project, just hit the badge mate! –> BestiapopBinder If you download files, you can retrieve them via the Jupyter interface :)
Data visualisation product from Bestiapop
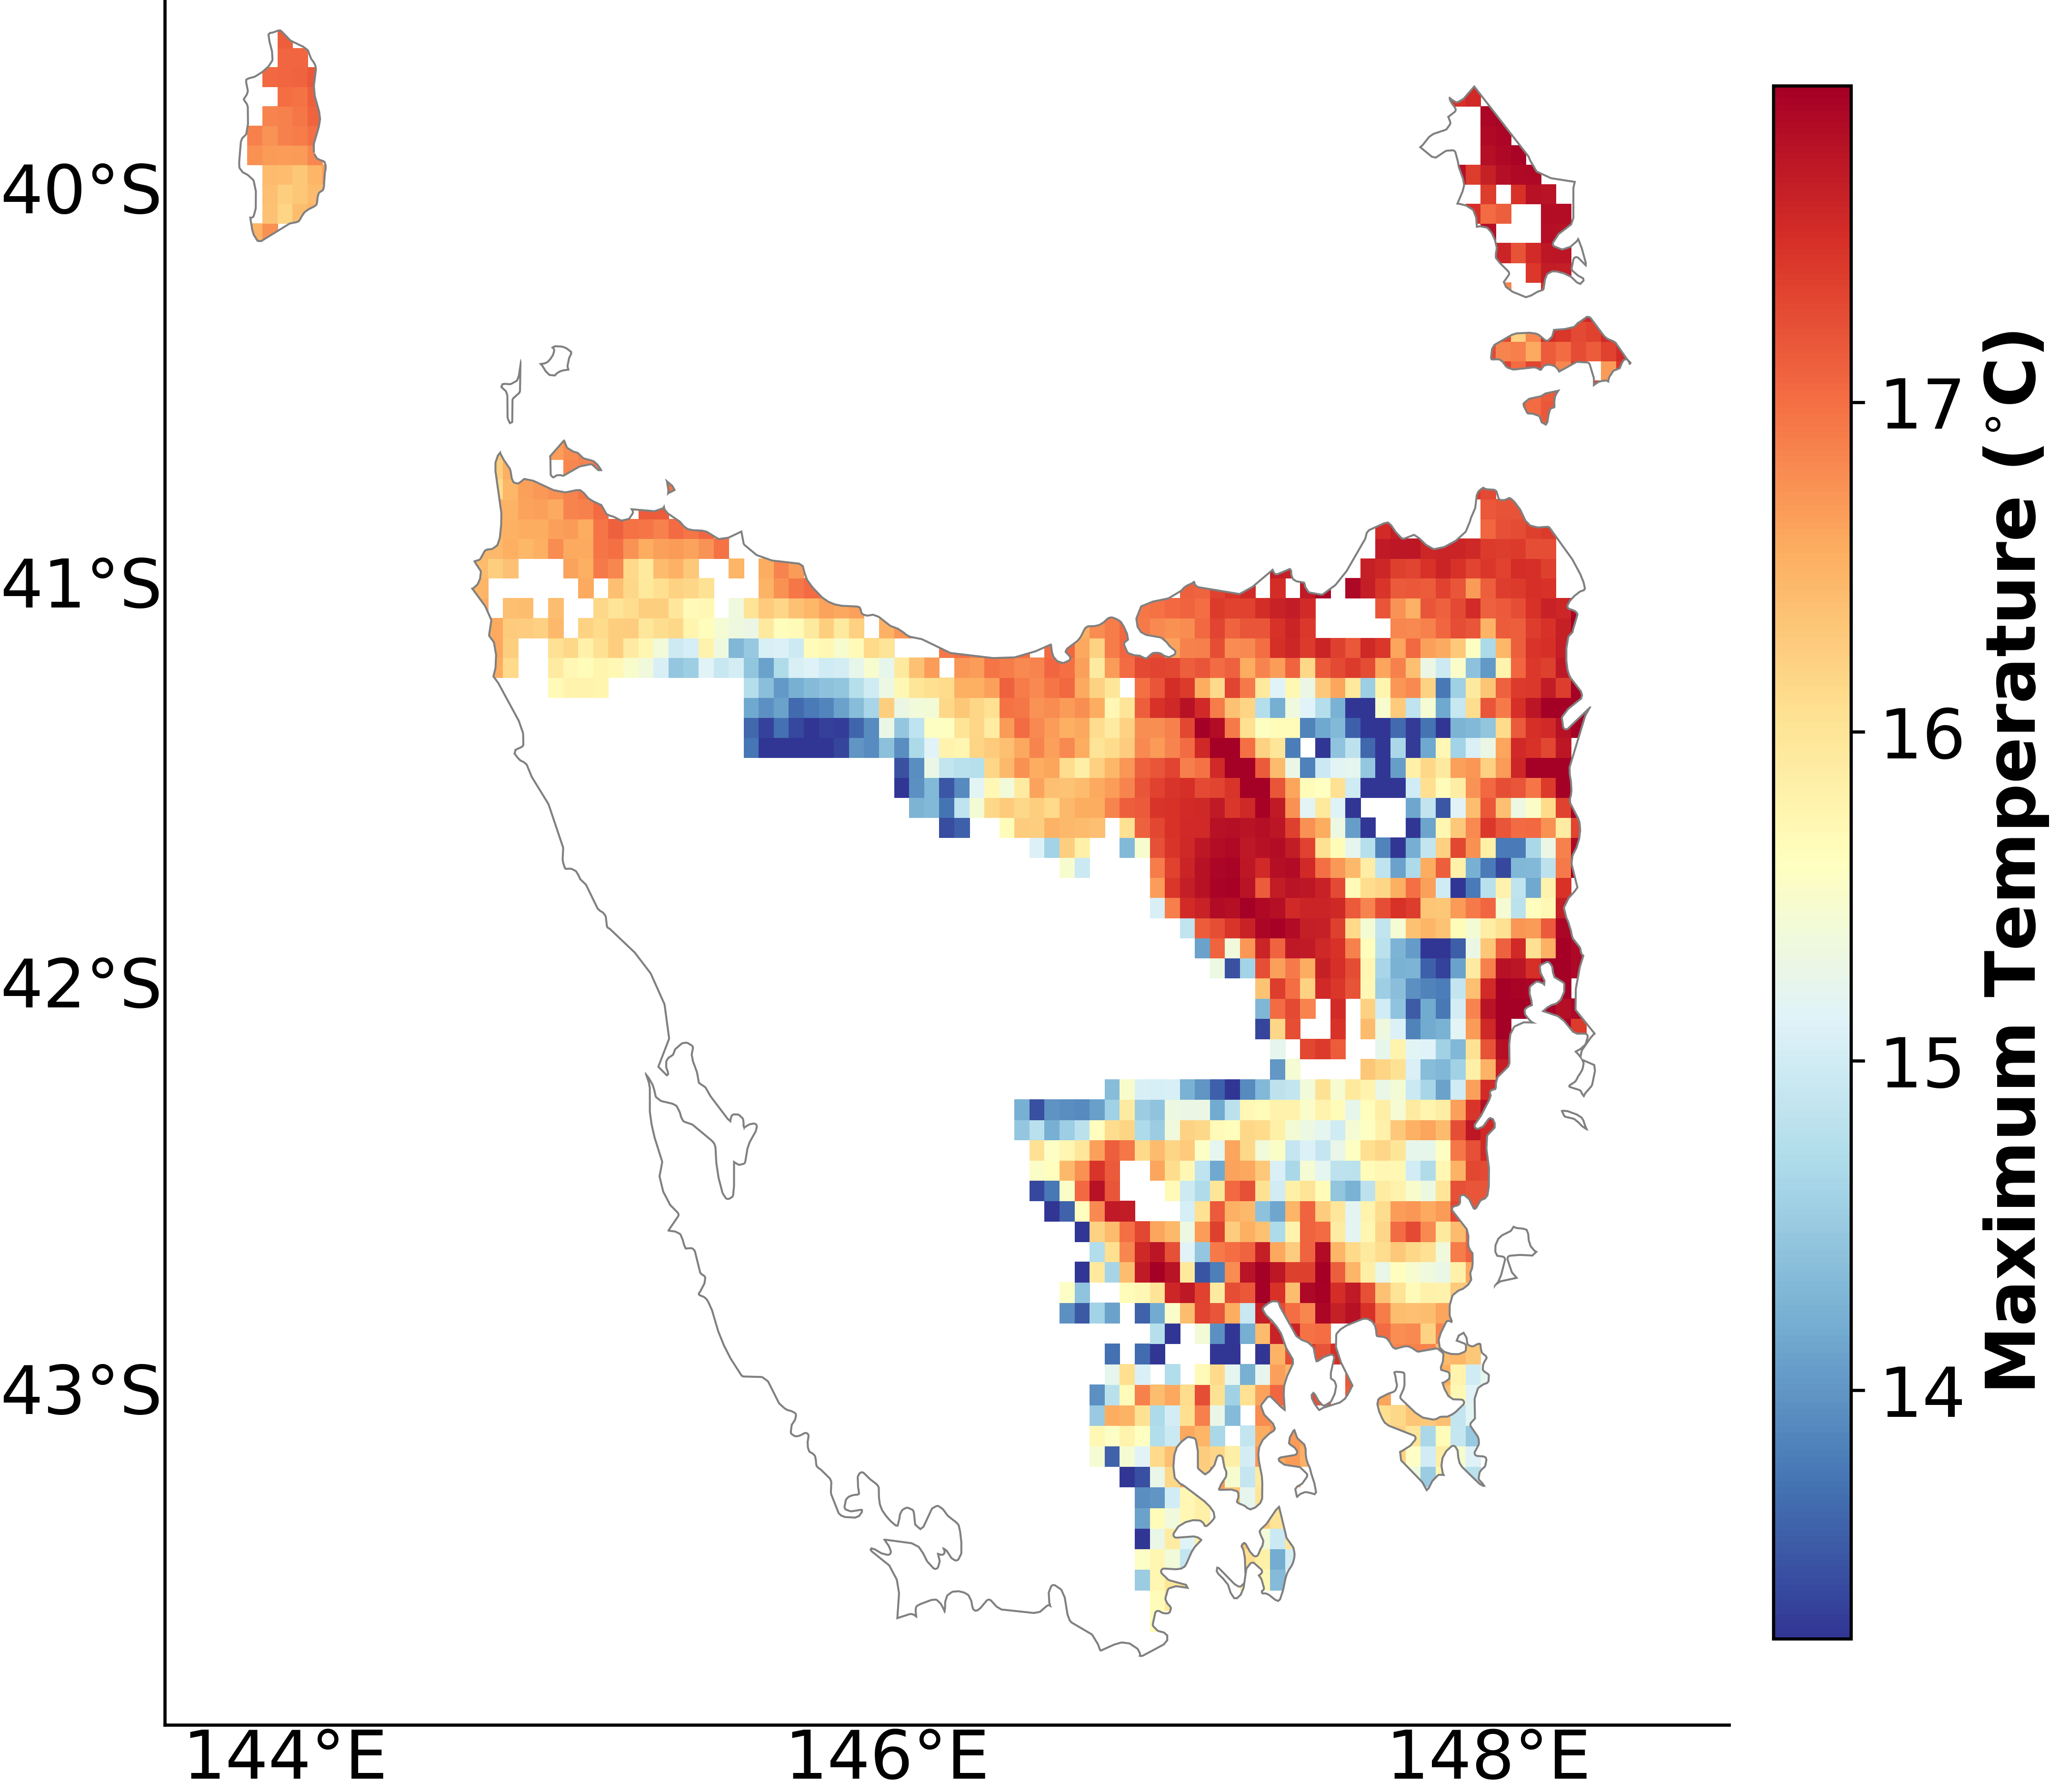
The 5 km grids in the figure represents the yearly mean [across 132 years (1889-2020)] of the mean maximum temperature retrieved from SILO
Read code documentation at:
References
Ojeda JJ, Eyshi Rezaei E, Remenyi TA, Webber HA, Siebert S, Meinke H, Webb MA, Kamali B, Harris RMB, Kidd DB, Mohammed CL, McPhee J, Capuano J, Ewert F (2021) Implications of data aggregation method on crop model outputs – The case of irrigated potato systems in Tasmania, Australia. European Journal of Agronomy.126, 126276. link
Ojeda JJ, Eyshi Rezaei E, Remenyi TA, Webb MA, Webber HA, Kamali B, Harris RMB, Brown JN, Kidd DB, Mohammed CL, Siebert S, Ewert F, Meinke H (2020) Effects of soil- and climate data aggregation on simulated potato yield and irrigation water requirement. Science of the Total Environment. 710, 135589. link
Jonathan Ojeda (Jony)
Science & Technology Executive – Carbon Markets & MRV | Scientific Founder @Terradot
Dynamic and results-driven Science & Technology Executive Leader with over 15 years of experience at the intersection of environmental science, carbon markets, and sustainable agriculture.