Quantifying the effects of G×E×M on the spatial variability of crop biomass in the US
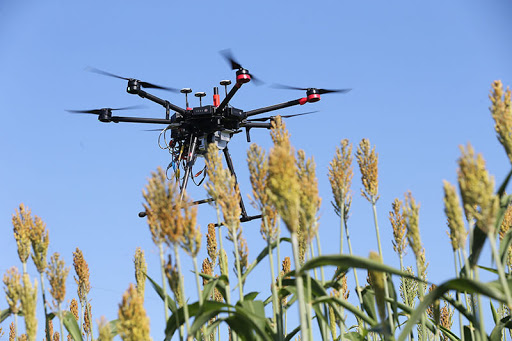 Photo by http://www.biomassmagazine.com/
Sending breeders into fields to manually measure the characteristics of plants is slow, laborious and expensive. Remote sensing technologies, coupled with advanced analytics and crop modelling, offer the promise of faster, more accurate data collection to improve the speed at which plant breeders can bring better cultivars to the market. This project is developing an automated, high-throughput field phenotyping system for determining how sorghum genetic variation impacts the crop’s biofuel production.
We use RGB images to parametrise different forage genotypes in APSIM and test the effect of genotype × management interactions on biomass production across environments. I am currently leading the sorghum biomass modelling in the UQ component of the joint project with Purdue. We are exploring the following questions:
- Which factors (G, E and M) are dominant in explaining sorghum biomass variability spatially?
- How do the drivers of sorghum biomass variability change with genotype and irrigation strategy across environments?
Using an APSIM parallel gridded system (pSIMS), four genotypes [grain (GS), sudangrass (SS), photosensitive, (PS) and photo-insensitive (PI)] were simulated across the potential areas for energy sorghum in the US under rainfed and irrigated conditions over 30 years at 30 arc-minute resolution. We used (i) correlation and clustering analysis, (ii) variance decomposition and (iii) maps to visualise the spatial variance of sorghum biomass. Simulated biomass was assessed by environments clustered using the sum of intercepted solar radiation (ir), mean of temperature stress factor (tp) and water stress factor (sw). We identified a need to quantify (i) the main G×E×M drivers of biomass variability based on environmental stress factors and (ii) the variance contribution of this drivers on sorghum biomass. Our regional-scale estimations are key inputs for future robust biomass projections of energy sorghum integrating G×E×M interactions under climate change scenarios.
You can see some results of the project below:
Visualising the environmental drivers of biomass spatial variability in the United States
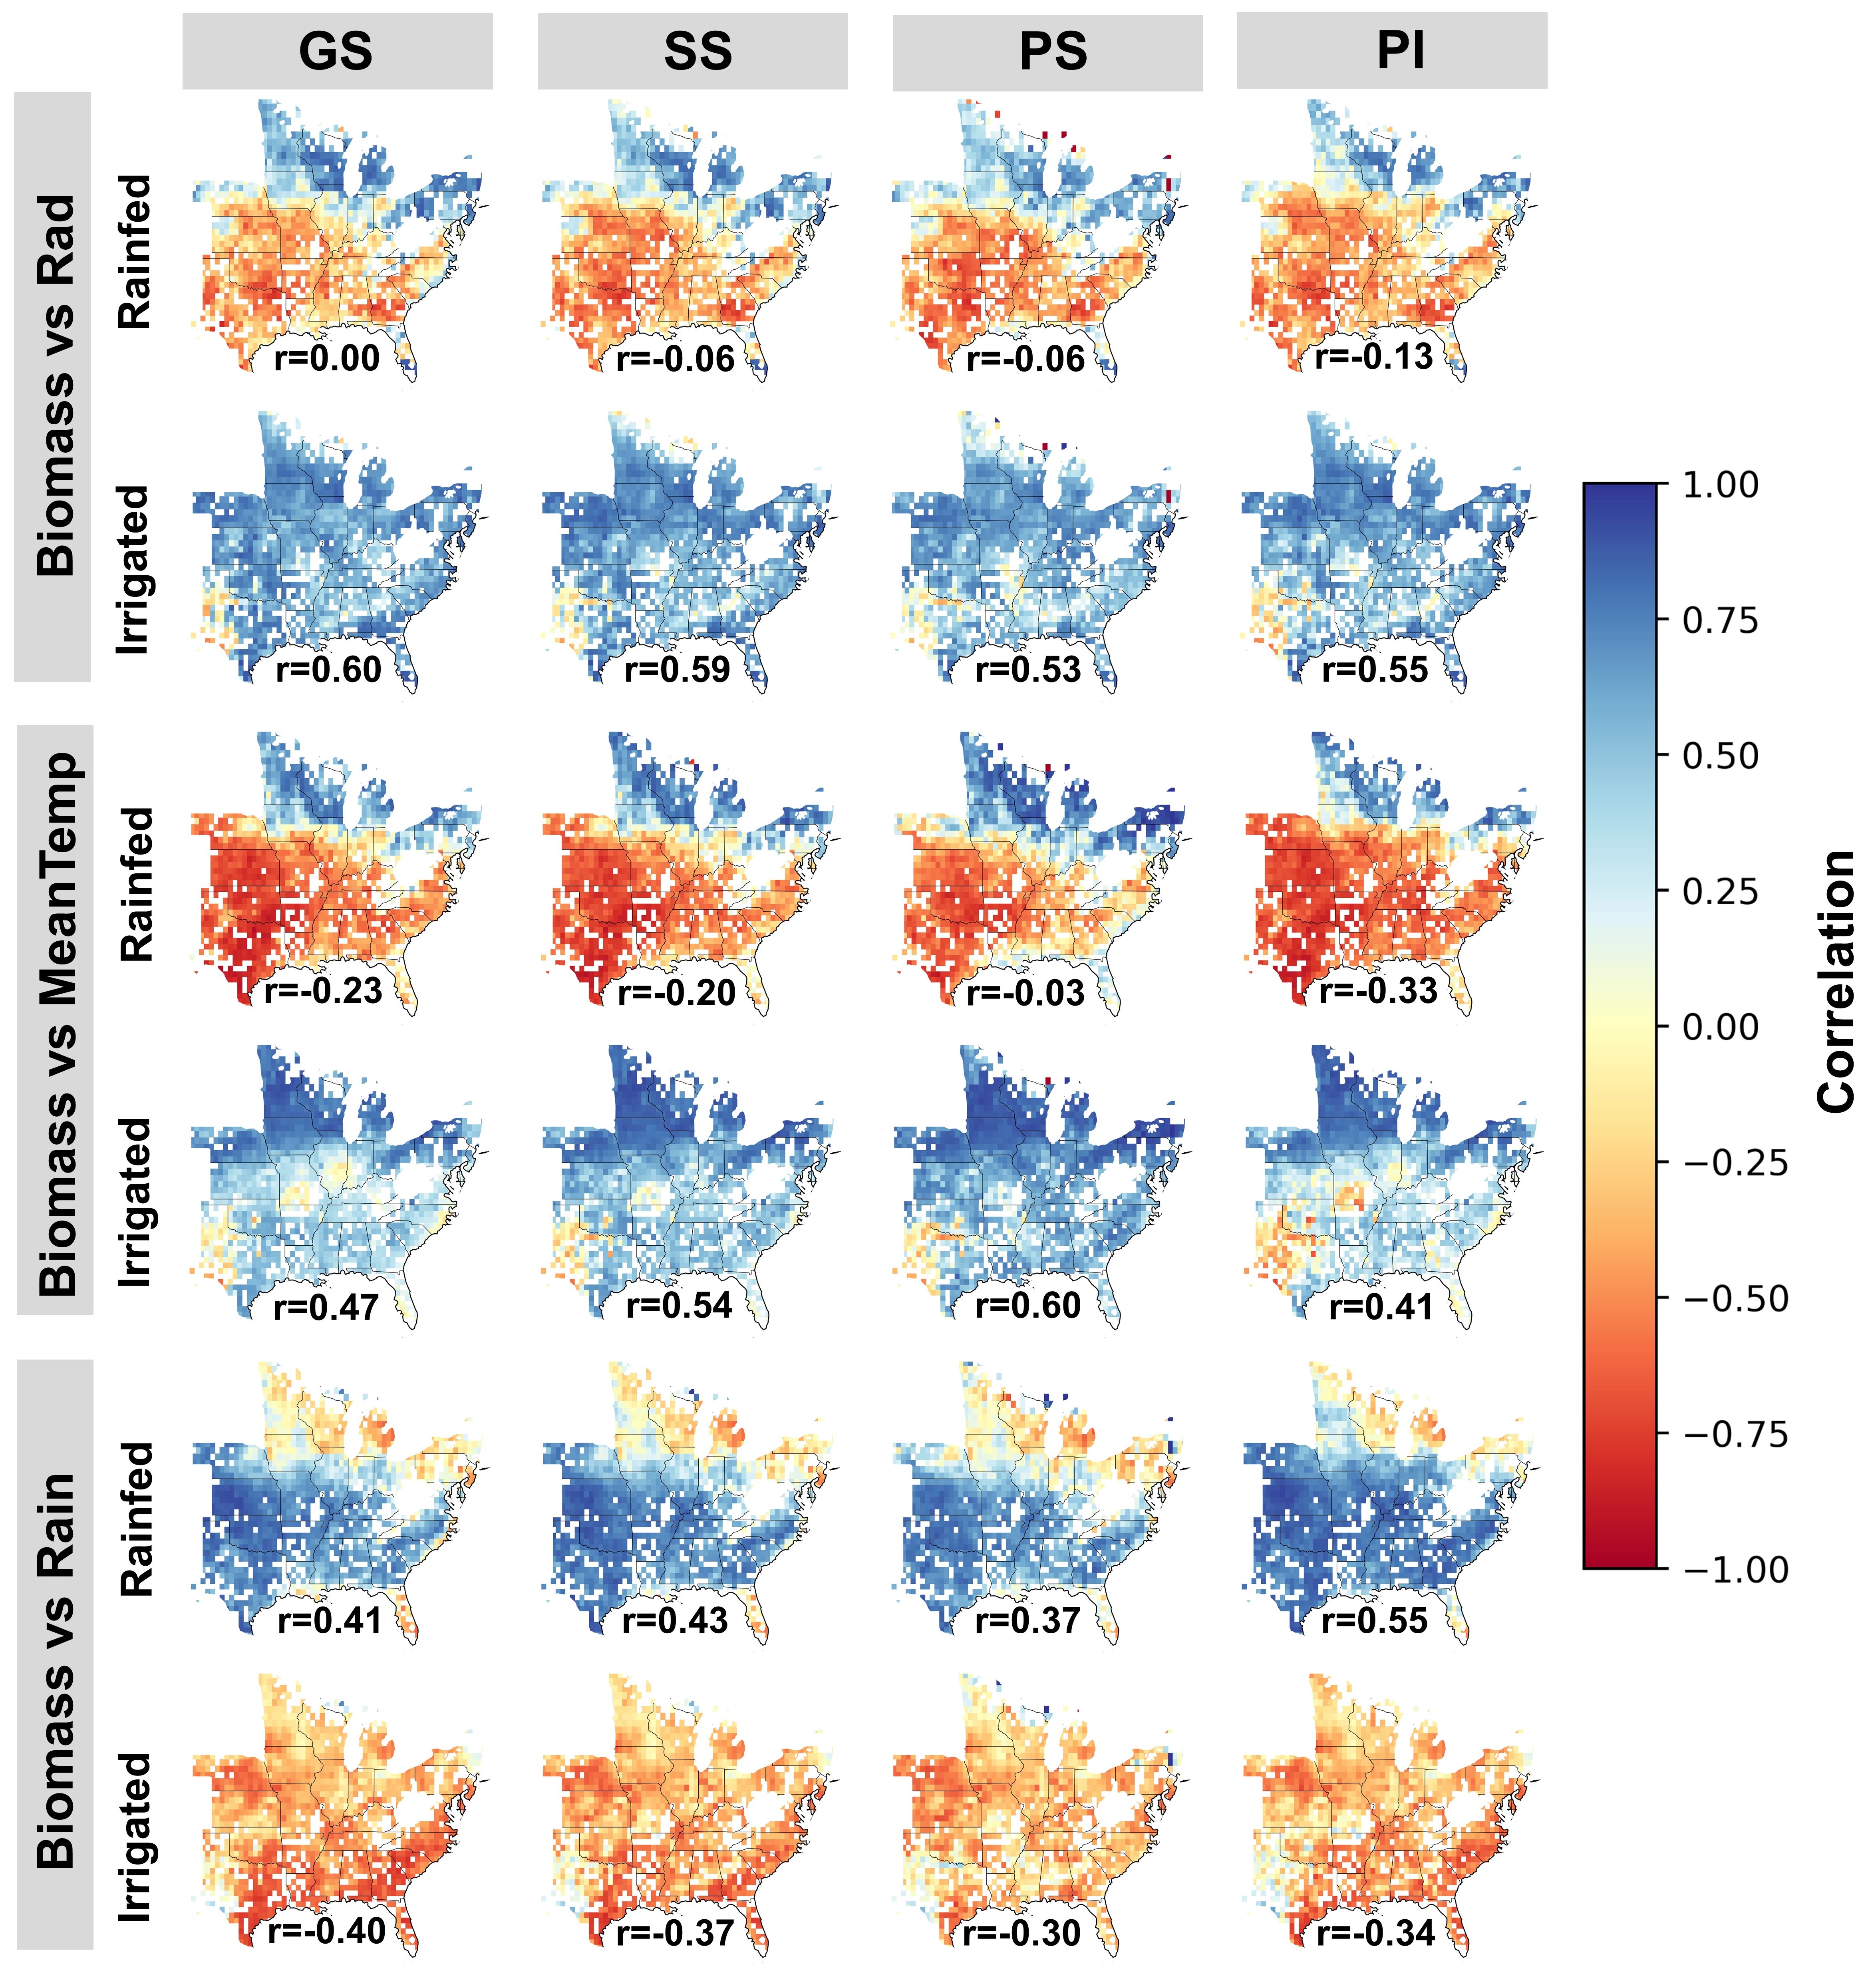
The image shows the spatial variability of correlations simulated at 30 arc-minute resolution between rainfed and irrigated sorghum biomass and solar radiation sum (Rad), mean temperature (MeanTemp) and rainfall sum (Rain) during the sorghum growing season for each genotype [grain sorghum (GS), sorghum sudangrass (SS), forage photosensitive sorghum, (PS) and forage photo insensitive sorghum (PI)] and irrigation strategy (rainfed and irrigated). Numbers below each map indicate the mean Pearson correlation coefficient between simulated biomass and each climate variable across all grids.
Partners
- Purdue University (Dr Tuinstra et al.)
- Iowa State University (Dr. Archontoulis, Isaiah Huber)
- IBM Research
- AgAlumni Seed, Corteva Agriscience, Beck’s Hybrids and Headwall Photonics
Funded by
U.S. Department of Energy Advanced Research Projects Agency–Energy (ARPA-E)
Grant amount
- First phase USD$6.6 million (2015)
- Second phase USD$9 million (2019)
Jonathan Ojeda (Jony)
Science & Technology Executive – Carbon Markets & MRV | Scientific Founder @Terradot
Dynamic and results-driven Science & Technology Executive Leader with over 15 years of experience at the intersection of environmental science, carbon markets, and sustainable agriculture.